Note
Go to the end to download the full example code.
Cyclic Deformation Tutorial
The cyclic deformation method is based on the paper: Respiratory cycle as time basis: An improved method for averaging olfactory neural events
URL: https://www.sciencedirect.com/science/article/pii/S0165027005003109
DOI: 10.1016/j.jneumeth.2005.09.004
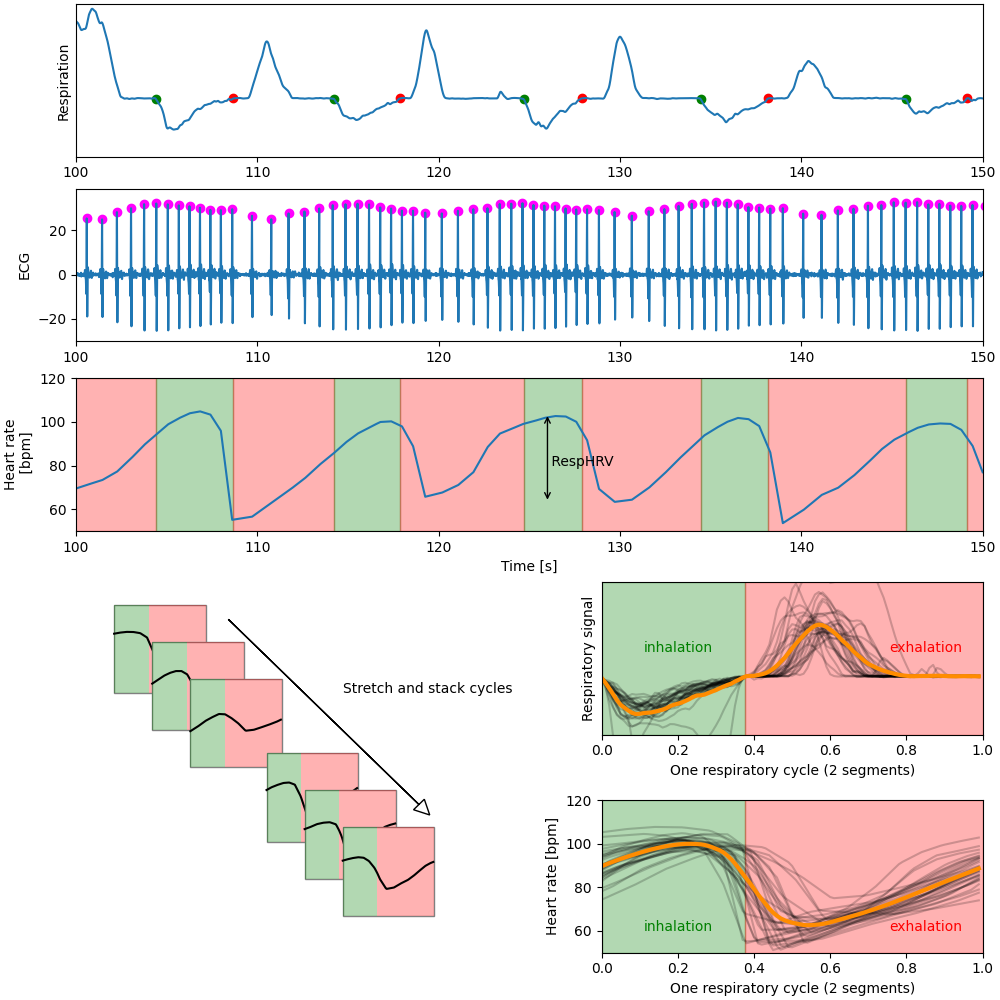
The main idea is to use respiratory cycles as a time basis for studying other signals, such as neural or heart rate time-series. Briefly, it works by stretching a trace using linear resampling based on a fixed number of points per cycle so that all cycles can be aligned.
This can be done with one or several segments used for reinterpolation. The most intuitive approach is to use two segments when analyzing the respiratory phases: inspiration and expiration.
This method is particularly useful for characterizing activity such as heart rate dynamics, normalized to the respiratory cycle. See also the RespHRV Tutorial tutorial for an application of this method.
import numpy as np
import matplotlib.pyplot as plt
from pathlib import Path

import physio
Read data
For this tutorial, we will use an internal file stored in NumPy format for demonstration purposes.
See Getting started tutorial, first section, for a description of
the capabilities of physio for reading raw data formats.
raw_resp = np.load('resp1_airflow.npy') # load respi
raw_ecg = np.load('ecg1.npy') # load ecg
srate = 1000. # our example signals have been recorded at 1000 Hz

times = np.arange(raw_resp.size) / srate # build time vector
Get respiratory cycles and ECG peaks using parameter_preset, and compute instantaneous heart rate
See Respiration tutorial and
ECG tutorial for a detailed explanation of how to use
compute_respiration() and compute_ecg(), respectively.
See ECG tutorial for more informations about the use of compute_instantaneous_rate().
resp, resp_cycles = physio.compute_respiration(raw_resp, srate, parameter_preset='human_airflow') # set 'human_airflow' as preset because example resp is an airflow from human
ecg, ecg_peaks = physio.compute_ecg(raw_ecg, srate, parameter_preset='human_ecg') # set 'human_ecg' as preset because example ecg is from human
instantaneous_heart_rate = physio.compute_instantaneous_rate(
    ecg_peaks,
    times,
    limits=[30, 200],
    units='bpm', # units in beats per minute
    interpolation_kind='linear',
)
Cyclic deformation
deform_traces_to_cycle_template() is a tool used to deform traces to a cycle template.
It works by stretching a trace using linear resampling based on a fixed number of points per cycle.
This is helpful to explore if features of a signal are driven by a cyclic phenomenon like respiration.
- To use this function, you must provide:
data : nd.array. Axis of the time must always be 0, meaning of shape (n_times,…).
times : np.array. Time vector of the data. Shape = (n_times,)
cycle_times : nd.array with shape (n_cycles, n_segments + 1). Typically, for respiration, cycle_times is an array with 3 columns (inspi_time + expi_time + next_inspi_time) that will make deformation with 2 segments. If cycle_times is 1D, then it is converted to shape (size-1, 2). The end of every cycles must match the start of the next cycle.
points_per_cycle : Number of phase points per cycle
segment_ratios : None or float or list of float. None if 1 segment. Float or list of float if 2 segments. List of floats if > 2 segments. This is a ratio between 0 and 1 where cycle is divided.
output_mode : ‘stacked’ / ‘unstacked’ / ‘unstacked_full’. Format of the outputs. Stacked -> 2D matrix : cycles / points per cycle. Unstacked -> 1D matrix : flattened version of the stacked. Unstacked_full returns extra-outputs.
Here, we deform the instantaneous heart rate trace by the respiratory cycle times. This leads to an average respiratory template. Importantly, this can be done using one or several segments inside the cycle. Note that the cycle times could come from another cycle phenomenon where you eventually detected particular timepoints.
# here we have 3 times per cycle so 2 segments :
# segment 1: inspiration to expiration
# segment 2: expiration to next inspiration
cycle_times = resp_cycles[['inspi_time', 'expi_time', 'next_inspi_time']].values # get 3 timepoints per cycle, dividing each cycle in 2 segments

points_per_cycle = 100 # number of points per cycle used for linear resampling
one_cycle = np.arange(points_per_cycle) / points_per_cycle # phase vector of the future matrix

inspi_ratio = resp_cycles['cycle_ratio'].mean() # ratio between 0 and 1 where cycle is divided into 2 segments, here the mean cycle ratio

cyclic_heart_rate_2seg = physio.deform_traces_to_cycle_template(instantaneous_heart_rate, # resp trace to deform
                                                            times, # time vector of instantaneous_heart_rate trace to deform
                                                             cycle_times,  # times of resp cycles, used to strech
                                                             points_per_cycle=points_per_cycle,  # number of points per cycle used for linear resampling
                                                             segment_ratios=inspi_ratio, # ratio between 0 and 1 where cycle is divided into 2 segments
                                                             output_mode='stacked' # choose a stacked version of the returned matrix
                                                             )
print(cyclic_heart_rate_2seg.shape, cycle_times.shape)

# here we have 2 times per cycle so 1 segment:
# segment 1: inspiration to next inspiration
cycle_times = resp_cycles[['inspi_time', 'next_inspi_time']].values # get 2 timepoints per cycle, dividing each cycle in 1 segment (so not dividing)
cyclic_heart_rate_1seg = physio.deform_traces_to_cycle_template(instantaneous_heart_rate, # instantaneous_heart_rate trace to deform
                                                            times, # time vector of instantaneous_heart_rate trace to deform
                                                             cycle_times,  # times of resp cycles, used to strech
                                                             points_per_cycle=points_per_cycle,  # number of points per cycle used for linear resampling
                                                             segment_ratios=None, # ratio between 0 and 1 where cycle is divided into 2 segments. None in this case because 1 segment
                                                             output_mode='stacked' # choose a stacked version of the returned matrix
                                                             )
print(cyclic_heart_rate_1seg.shape, cycle_times.shape)

# it is also possible to deform the respiratory trace by "itself": the respiratory cycle
cycle_times = resp_cycles[['inspi_time', 'expi_time', 'next_inspi_time']].values # get 3 timepoints per cycle, dividing each cycle in 2 segments
cyclic_resp_2seg = physio.deform_traces_to_cycle_template(resp, # resp trace to deform
                                                            times, # time vector of resp trace to deform
                                                             cycle_times,  # times of resp cycles, used to strech
                                                             points_per_cycle=points_per_cycle,  # number of points per cycle used for linear resampling
                                                             segment_ratios=inspi_ratio, # ratio between 0 and 1 where cycle is divided into 2 segments
                                                             output_mode='stacked' # choose a stacked version of the returned matrix
                                                             )
print(cyclic_resp_2seg.shape, cycle_times.shape)
(30, 100) (30, 3)
(30, 100) (30, 2)
(30, 100) (30, 3)
Example of a summary figure explaining cyclic deformation of heart rate by respiration
A lot of messy matplotlib code for a fairly clear figure… essentially the one from the toolbox paper!
fig = plt.figure(layout="constrained", figsize=(10, 10))
gs = plt.GridSpec(nrows=5, ncols=4, figure=fig)

ax = ax_A = fig.add_subplot(gs[0, :])

ax.set_ylabel('Respiration')
ax.plot(times, resp)
inspi_index = resp_cycles['inspi_index'].values
expi_index = resp_cycles['expi_index'].values
ax.scatter(times[inspi_index], resp[inspi_index], marker='o', color='green')
ax.scatter(times[expi_index], resp[expi_index], marker='o', color='red')
ax.set_yticks([])
ax.set_ylim(-1750, -1450)

ax = ax_B = fig.add_subplot(gs[1, :],  sharex=ax)
ax.set_ylabel('ECG')

ax.plot(times, ecg)
ecg_peak_ind = ecg_peaks['peak_index'].values
ax.scatter(times[ecg_peak_ind], ecg[ecg_peak_ind], marker='o', color='magenta')

ax = ax_C = fig.add_subplot(gs[2, :], sharex=ax)
ax.set_ylabel('Heart rate\n [bpm]')
ax.plot(times, instantaneous_heart_rate)
for c, cycle in resp_cycles.iterrows():
    ax.axvspan(cycle['inspi_time'], cycle['expi_time'], color='g', alpha=0.3)
    ax.axvspan(cycle['expi_time'], cycle['next_inspi_time'], color='r', alpha=0.3)
ax.set_ylim(50, 120)
ax.set_xlim(100, 150)
ax.annotate(text='', xy=(126,104), xytext=(126, 63), arrowprops=dict(arrowstyle='<->'))
ax.text(126, 80, ' RespHRV', ha='left')
ax.set_xlabel('Time [s]')


ax = ax_D = fig.add_subplot(gs[3:, :2])
for k in ('top', 'right', 'left', 'bottom'):
    ax.spines[k].set_visible(False)
ax.set_xticks([])
ax.set_yticks([])
w = 120.
rectangles = []
for i in range(7):
    if i in (3, ):
        continue
    z = (i + 1) * 10
    x = 100 + i * 50
    y = 400 - i * 50
    rect = plt.Rectangle((x, y), w, w, ec='gray', fc='w', zorder=z+1)
    ax.add_patch(rect)
    rect = plt.Rectangle((x, y), w*inspi_ratio, w, ec=None, fc='g', alpha=0.3, zorder=z+2)
    ax.add_patch(rect)
    rect = plt.Rectangle((x + w * inspi_ratio, y), w * (1 - inspi_ratio), w,  ec=None, fc='r', alpha=0.3, zorder=z+3)
    ax.add_patch(rect)
    cycle_phase = np.arange(points_per_cycle) / points_per_cycle
    cycle_value = cyclic_heart_rate_2seg[i, :]
    ax.plot(cycle_phase * w + x, cycle_value + y + w /2 - np.mean(cycle_value), color='black', zorder=z + 5)
ax.arrow(250, 500, 250, -250, head_width=20, head_length=20, fc='w', ec='k')
ax.text(400, 400, "Stretch and stack cycles")


ax.set_xlim(50, 550)
ax.set_ylim(50, 550)


ax = ax_E = fig.add_subplot(gs[3, 2:])
ax.plot(one_cycle, cyclic_resp_2seg.T, color='k', alpha=0.2)
ax.plot(one_cycle, np.mean(cyclic_resp_2seg, axis=0), color='darkorange', lw=3)
ax.axvspan(0, inspi_ratio, color='g', alpha=0.3)
ax.axvspan(inspi_ratio, 1, color='r', alpha=0.3)
ax.set_ylabel('Respiratory signal')
ax.text(0.2, -1600, 'inhalation', ha='center', color='g')
ax.text(0.85, -1600, 'exhalation', ha='center', color='r')
ax.set_xlabel('One respiratory cycle (2 segments)')
ax.set_xlim(0, 1)
ax.set_yticks([])
ax.set_ylim(-1720, -1500)


ax = ax_F = fig.add_subplot(gs[4, 2:])
ax.plot(one_cycle, cyclic_heart_rate_2seg.T, color='k', alpha=0.2)
ax.plot(one_cycle, np.mean(cyclic_heart_rate_2seg, axis=0), color='darkorange', lw=3)
ax.axvspan(0, inspi_ratio, color='g', alpha=0.3)
ax.axvspan(inspi_ratio, 1, color='r', alpha=0.3)
ax.set_ylim(50, 120)
ax.set_ylabel('Heart rate [bpm]')
ax.text(0.2, 60, 'inhalation', ha='center', color='g')
ax.text(0.85, 60, 'exhalation', ha='center', color='r')
ax.set_xlabel('One respiratory cycle (2 segments)')
ax.set_xlim(0, 1)


plt.show()
Total running time of the script: (0 minutes 0.415 seconds)